heatmap#
Plot a heatmap of any pandas DataFrame with optional axis labels, annotations, and custom color-scaling.
📥 Arguments#
Name |
Type |
Required |
Description |
|---|---|---|---|
data |
pd.DataFrame |
✅ |
Pandas DataFrame containing the matrix to visualize; index and columns are used as y- and x-labels by default. |
x_labels |
List[str] |
❌ |
Labels for columns (overrides DataFrame columns). |
y_labels |
List[str] |
❌ |
Labels for rows (overrides DataFrame index). |
x_category |
str |
❌ |
Category for x-axis labels (overrides DataFrame columns). |
y_category |
str |
❌ |
Category for y-axis labels (overrides DataFrame index). |
figsize |
tuple |
❌ |
Figure size (width, height), e.g., (8, 6). |
cmap |
str |
❌ |
Name of matplotlib colormap, e.g., ‘viridis’. |
vmin |
float |
❌ |
Minimum data value for color scaling. |
vmax |
float |
❌ |
Maximum data value for color scaling. |
annot |
bool |
❌ |
If True, overlay numeric annotations on each cell. |
fmt |
str |
❌ |
Format string for annotations, e.g. ‘.2f’ or ‘d’. |
cbar |
bool |
❌ |
Whether to display the colorbar. |
title |
str |
❌ |
Title of the heatmap. |
save |
str |
❌ |
Base filename to save PNG and PDF (without extension). |
cbar_title |
str |
❌ |
Title for the colorbar. |
fontsize |
float |
❌ |
Base font size for axis labels, tick labels, title, cell annotations, and colorbar label. |
ax |
matplotlib.axes.Axes |
❌ |
Matplotlib Axes object to plot on. If None, a new figure is created. |
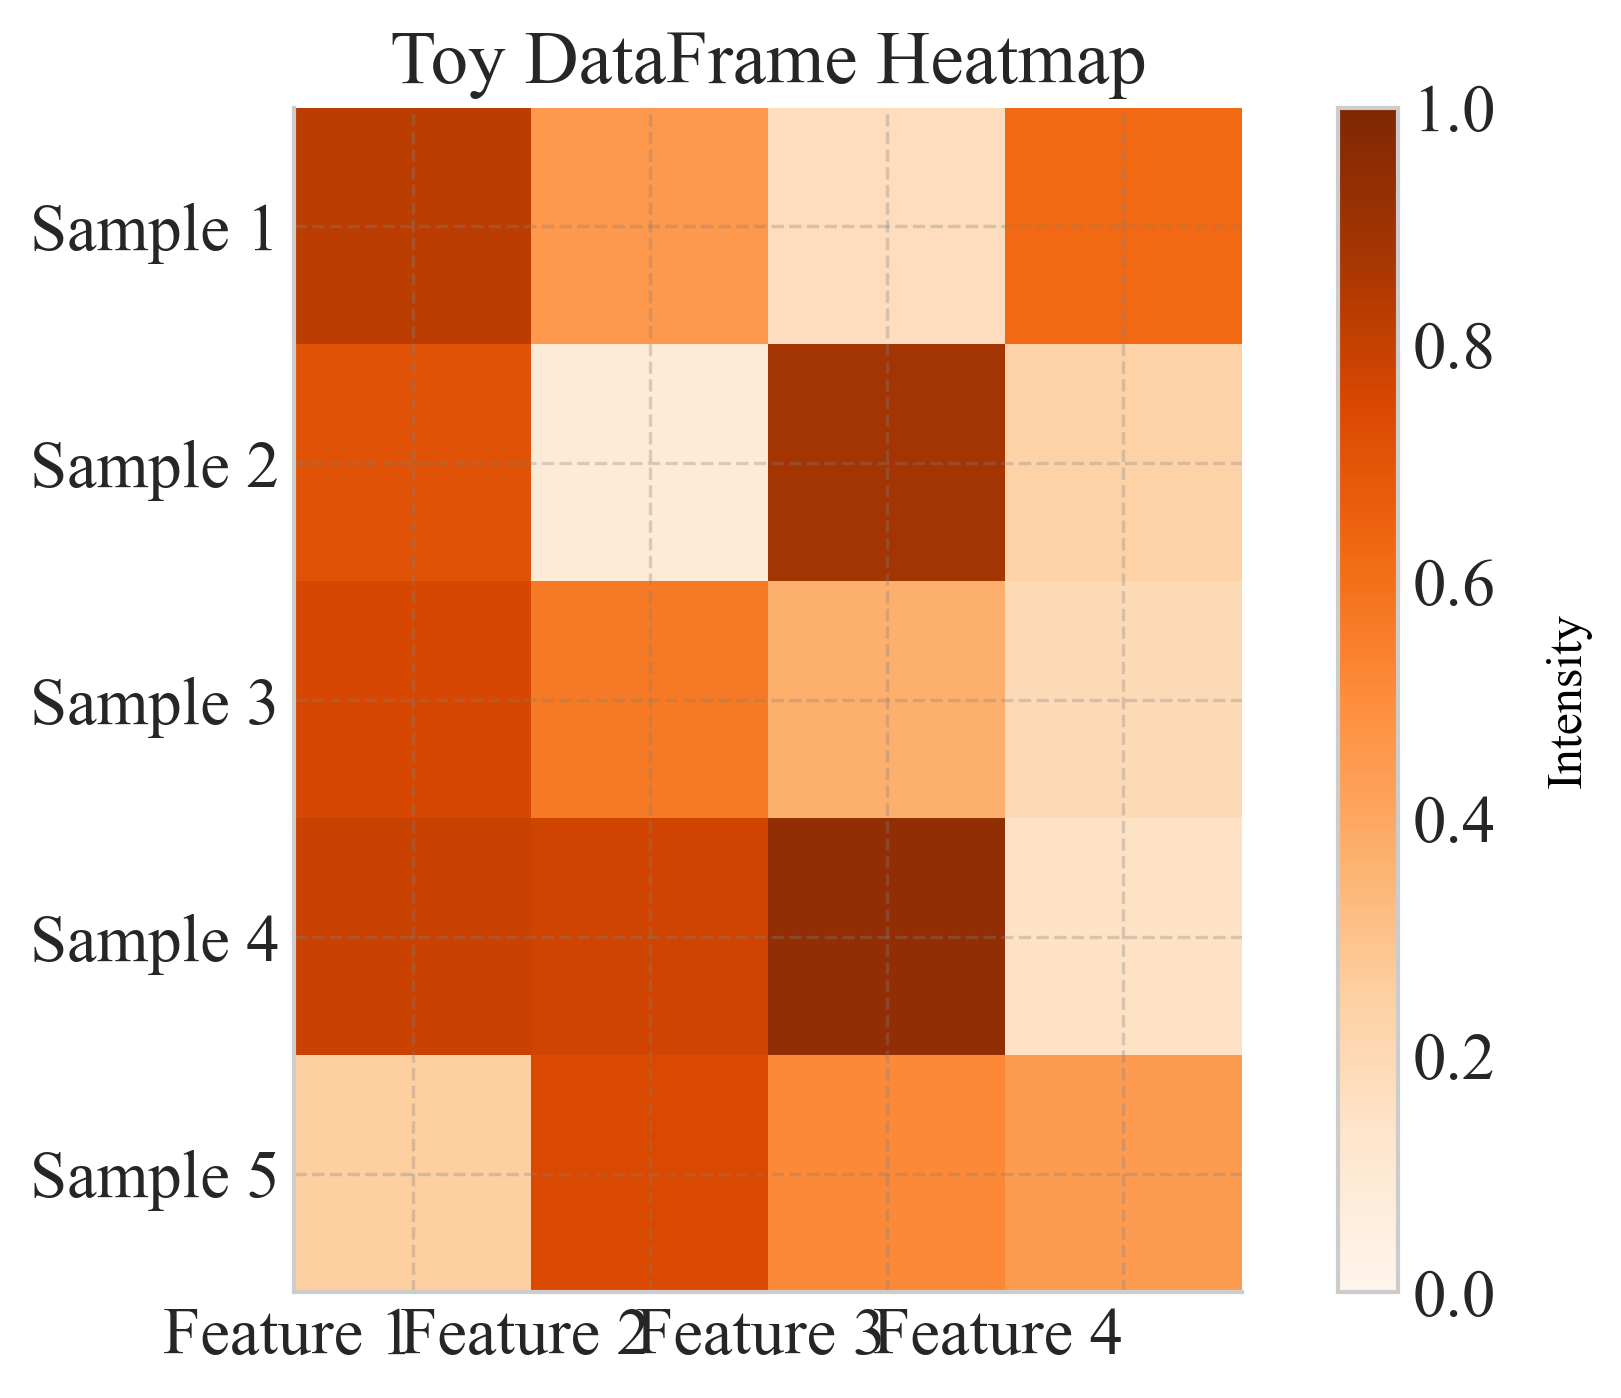
📦 Example Output#
Click to show example code
import pandas as pd
import matplotlib.pyplot as plt
from swizz import plot

# 1) Create the exact DataFrame from your example image
data = pd.DataFrame({
    10: {6:  0.93,  9: 0.86, 12: 0.86},
    20: {6:  0.92,  9: 0.88, 12: 0.86},
    50: {6:  0.92,  9: 0.90, 12: 0.75},
    100:{6:  0.75,  9: 0.90, 12: 0.78},
})
data.index.name = "Radius"
data.columns.name = "Team Reward"

# 2) Plot with annotations, custom colormap, cbar label, axis labels, and save output
fig, ax = plot(
    "heatmap",
    data=data,
    figsize=(7, 5),
    cmap="Blues",
    vmin=0.70,
    vmax=0.95,
    annot=True,
    fmt=".2f",
    cbar=True,
    cbar_title="Lone Wolf Rate",
    save="lone_wolf_rate_heatmap",
    x_category="Team Reward",
    y_category="Radius",
)

# 3) Show the figure
plt.show()