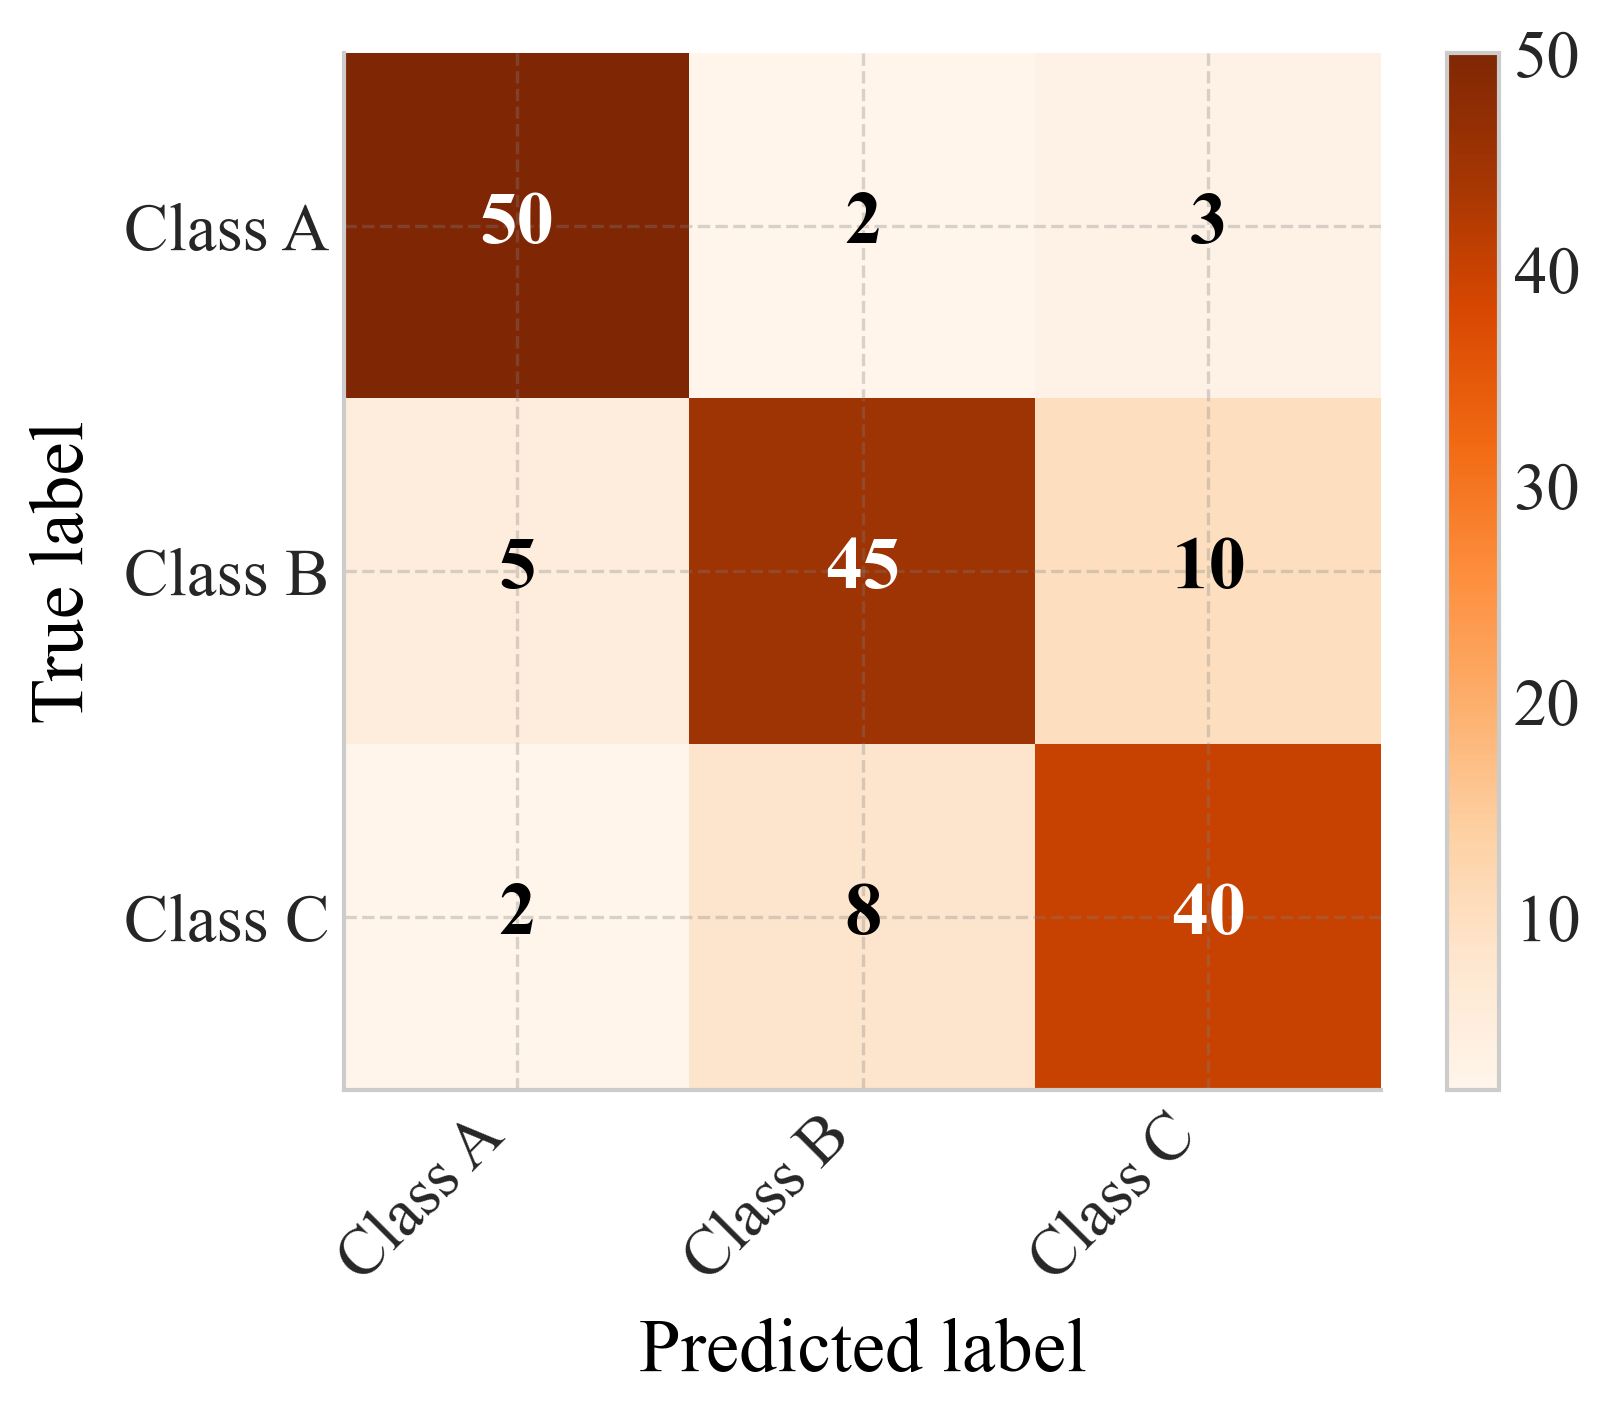
confusion_matrix#
Plot a confusion matrix heatmap with optional normalization and annotations.
📥 Arguments#
Name |
Type |
Required |
Description |
|---|---|---|---|
cm |
pd.DataFrame |
✅ |
Confusion matrix as a pandas DataFrame (shape N×N). |
labels |
List[str] |
❌ |
List of class labels, length N, corresponding to matrix indices. If None, use DataFrame index/columns. |
figsize |
tuple |
❌ |
Figure size, e.g., (8, 6). |
cmap |
str |
❌ |
Matplotlib colormap name, e.g., ‘Blues’. |
normalize |
bool |
❌ |
If True, normalize rows to sum to 1 before plotting. |
title |
str |
❌ |
Optional title for the plot. |
fmt |
str |
❌ |
Format string for annotations, e.g., ‘d’ or ‘.2f’. |
cbar |
bool |
❌ |
Whether to display the colorbar. |
save |
str |
❌ |
Base filename to save PNG and PDF outputs. |
fontsize |
float |
❌ |
Base font size for annotations, ticks, and title. |
📦 Example Output#
Click to show example code
import pandas as pd
import matplotlib.pyplot as plt
from swizz import plot

# 1) Define a toy confusion matrix as a DataFrame
data = [
    [50,  2,  3],
    [ 5, 45, 10],
    [ 2,  8, 40],
]
labels = ["Class A", "Class B", "Class C"]
cm_df = pd.DataFrame(data, index=labels, columns=labels)

# 2) Plot raw counts
fig1, ax1 = plot(
    "confusion_matrix",
    cm=cm_df,
    labels=labels,  # optional, can be omitted since already in the DataFrame
    figsize=(6, 5),
    cmap="Oranges",
    normalize=False,
    fmt="d",
    cbar=True,
    save="confusion_matrix_raw"
)
plt.show()